Hi, I’m James. Thanks for checking out Building Momentum: a newsletter to help startup founders and marketers accelerate SaaS growth through product marketing.
Revenue models can be really freaking confusing, especially for someone who’s never been exposed to that side of the business before.
But luckily, they’re not too complicated – once you understand what you’re looking at.
In this post I’m going to walk through how you can approach building a revenue model for your product.
In this post:
Why should product marketers know the financial model?
As PMMs, we’re super close to how the product is marketed and sold. We should understand the total, addressable, and obtainable market opportunity over the short-to-long-term.
We want to work with sales, to accurately set expectations around product performance in the market. We want to work with growth and marketing teams to understand the funnel, set goals, and plan the campaigns required to meet targets.
But we also need a good understanding of P&L fundamentals like margins, COGS, etc. The decisions we make – around target customer, positioning, pricing, and product details – are all interconnected – and directly relate to the success and return on investment of our products.
Financial model template
For this post, we’ll use the early-stage SaaS financial model created by marker.io – you can copy the Google Sheet template here.
The template has four tabs:
- Recap – this is your overview of the total revenue, costs, and profit by year
- Growth Hypotheses – here you’ll adjust assumptions around growth rates, pricing, and churn
- Costs Hypotheses – assumptions around spending, including any staff, marketing, and other expenses
- Financial model – your month-by-month breakdown of how everything adds up, breaks down, and turns out
The template is built for startup founders, so isn’t exactly what you need, but has enough bones for you to customize for your own needs. You may want to remove references to staff costs, make marketing costs dollar amounts rather than a percentage of revenue, and reword or delete miscellaneous costs as necessary.
Using the revenue model template
Growth assumptions
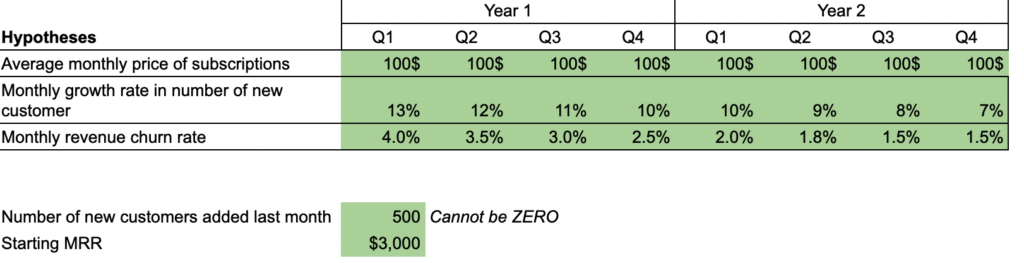
On the growth tab, it’s time to input the following:
Average monthly price of subscriptions. How much monthly recurring revenue will your customers pay each? You may want to consider blending or adjusting the fields and formulas to account for discounts, average size of customers, pricing package uptake, etc
Monthly growth in number of new customers. How are you growing month-over-month? This is measured as a percentage of the existing customer base. Consider product/market-fit, the maturity of the market, sales cycle length, and seasonality.
Monthly revenue churn rate. Each month, what percentage of the customer base stop paying for your product? You’ll always have some level of churn whether it’s customers actively dissatisfied with your product, new customers that never get up-and-running, or customers going bust and no longer able to pay their bills.
If you’re launching a brand new product into the market, you’ll also need to think about:
- Number of new customers added last month (i.e. the number of customers you start with) – your beta customers, early adopters, etc.
- Starting MRR – the monthly recurring revenue you start with (from those initial customers!)
Cost assumptions
Click on to tab two to start playing around with your spend. You can either use this template as-is to capture operating expenses for a fuller picture, or remove items not involved with the creating/selling/providing the product.
Personnel. You can use this to track personnel costs to support the product, e.g. any operational team members required, or go broader to consider all of those who work on building, shipping, marketing, selling, and supporting your product.
Marketing spend. The template uses a percentage of MRR to estimate how much money you’ll put on marketing activity. Update these fields (or create new ones) to accurately estimate where you’ll be spending money on promotion.
Cost of goods sold. Every SaaS will have a cost to serve product to a customer. The template contains fields for payment processing and hosting/bandwidth costs – you may want to update or create new fields to capture additional costs involved in delivering product, like any third-party software license fees.
Miscellaneous. Pretty straightforward – use to capture any additional costs.
Check the numbers!
You’ve thought about your product’s growth potential and been rational about the costs you’ll experience.
Now you can review the financial model tab to see how things pan out.
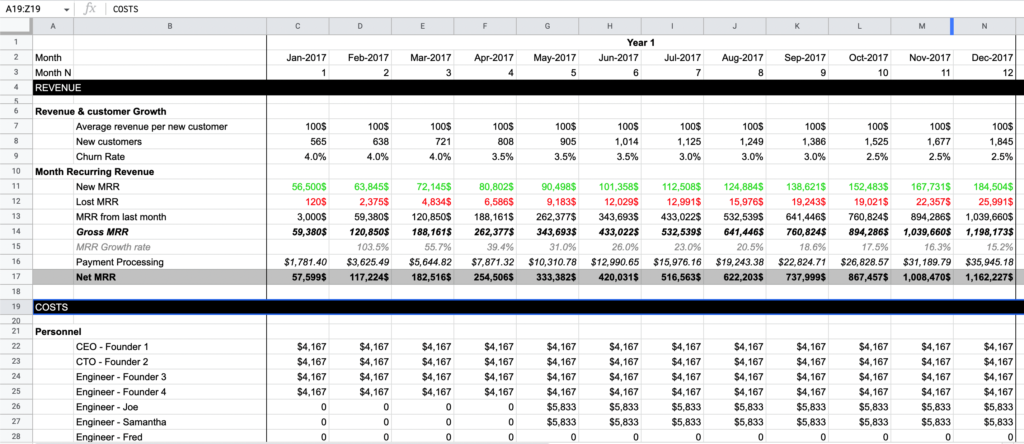
Revenue. The top section looks at all the incoming customer growth, how many will churn, and the resulting revenue from their customership.
Costs. All those costs you entered now appear, month-by-month, so you can see total costs add up.
Profit and loss. Now we’re summarising the incomes, outgoings, and impact on the bottom line.
- Gross MRR – Monthly revenue before any deductions
- COGS – Any cost line items that are deducted from the gross MRR, involved with making, selling, and providing the product
- Gross Profit – Profit after deducting COGS
- % – your gross profit margin shows how much more revenue you generate than spend.
- Operating expenses – If you’re going deeper than just the costs involved in delivering the product, you’ll track other costs here
- Operating margin – If you take the gross profit, minus all the operating expenses, how much profit is left at the end? The spreadsheet uses the phrase ‘Earnings before interest and tax’ (EBIT), also known as operating income.
- % – your operating margin, expressed as a percentage of revenue
Analyze the revenue model
You’ve gone through the process and you’ve got all the numbers in place. The assumptions are pretty realistic – now it’s time to interrogate the output.
Switch back to the first tab and you’ll see your ARR, costs, EBIT outcomes by year – plus if there’s a shortfall, how much cash you’ll need to cover outgoings.
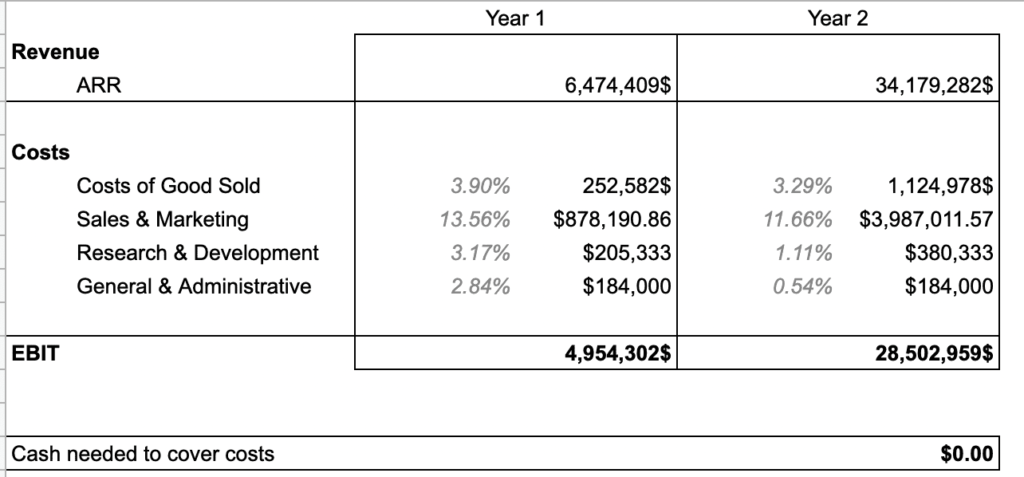
Updating any of the numbers for growth and costs will impact the outcomes – and don’t forget that everything compounds with SaaS.
You’ll want to think hard about the financial model and whether it really works for your business.
As a starting point, questions you’ll need to consider are:
- What happens if you increase the price and reduce growth… or vice versa?
- Where are there areas to reduce costs to improve margins?
- Does the gross profit margin work for your finance team?
- Is there seasonality in your sales or costs that you can adjust or avoid?
You can then work back with sales and marketing to identify the number of sales reps you need to hit revenue goals, and predict the number of opportunities and leads that marketing and sales need to generate.
Now, the hard part
Creating and analyzing your revenue model is actually surprisingly easy.
The hard part is to share, align, socialize, refine, monitor, track, learn, and iterate with your wider go-to-market team.
Good luck!
Thanks for reading! Let me know what you thought – find me on Twitter and LinkedIn.
P.S. If you’ve found value in Building Momentum, could you buy me a coffee? Here’s my tip jar – any support is gratefully appreciated!
P.P.S: If you enjoyed this post, will you share Building Momentum with your network?